
Overview of the Explore Data subtab
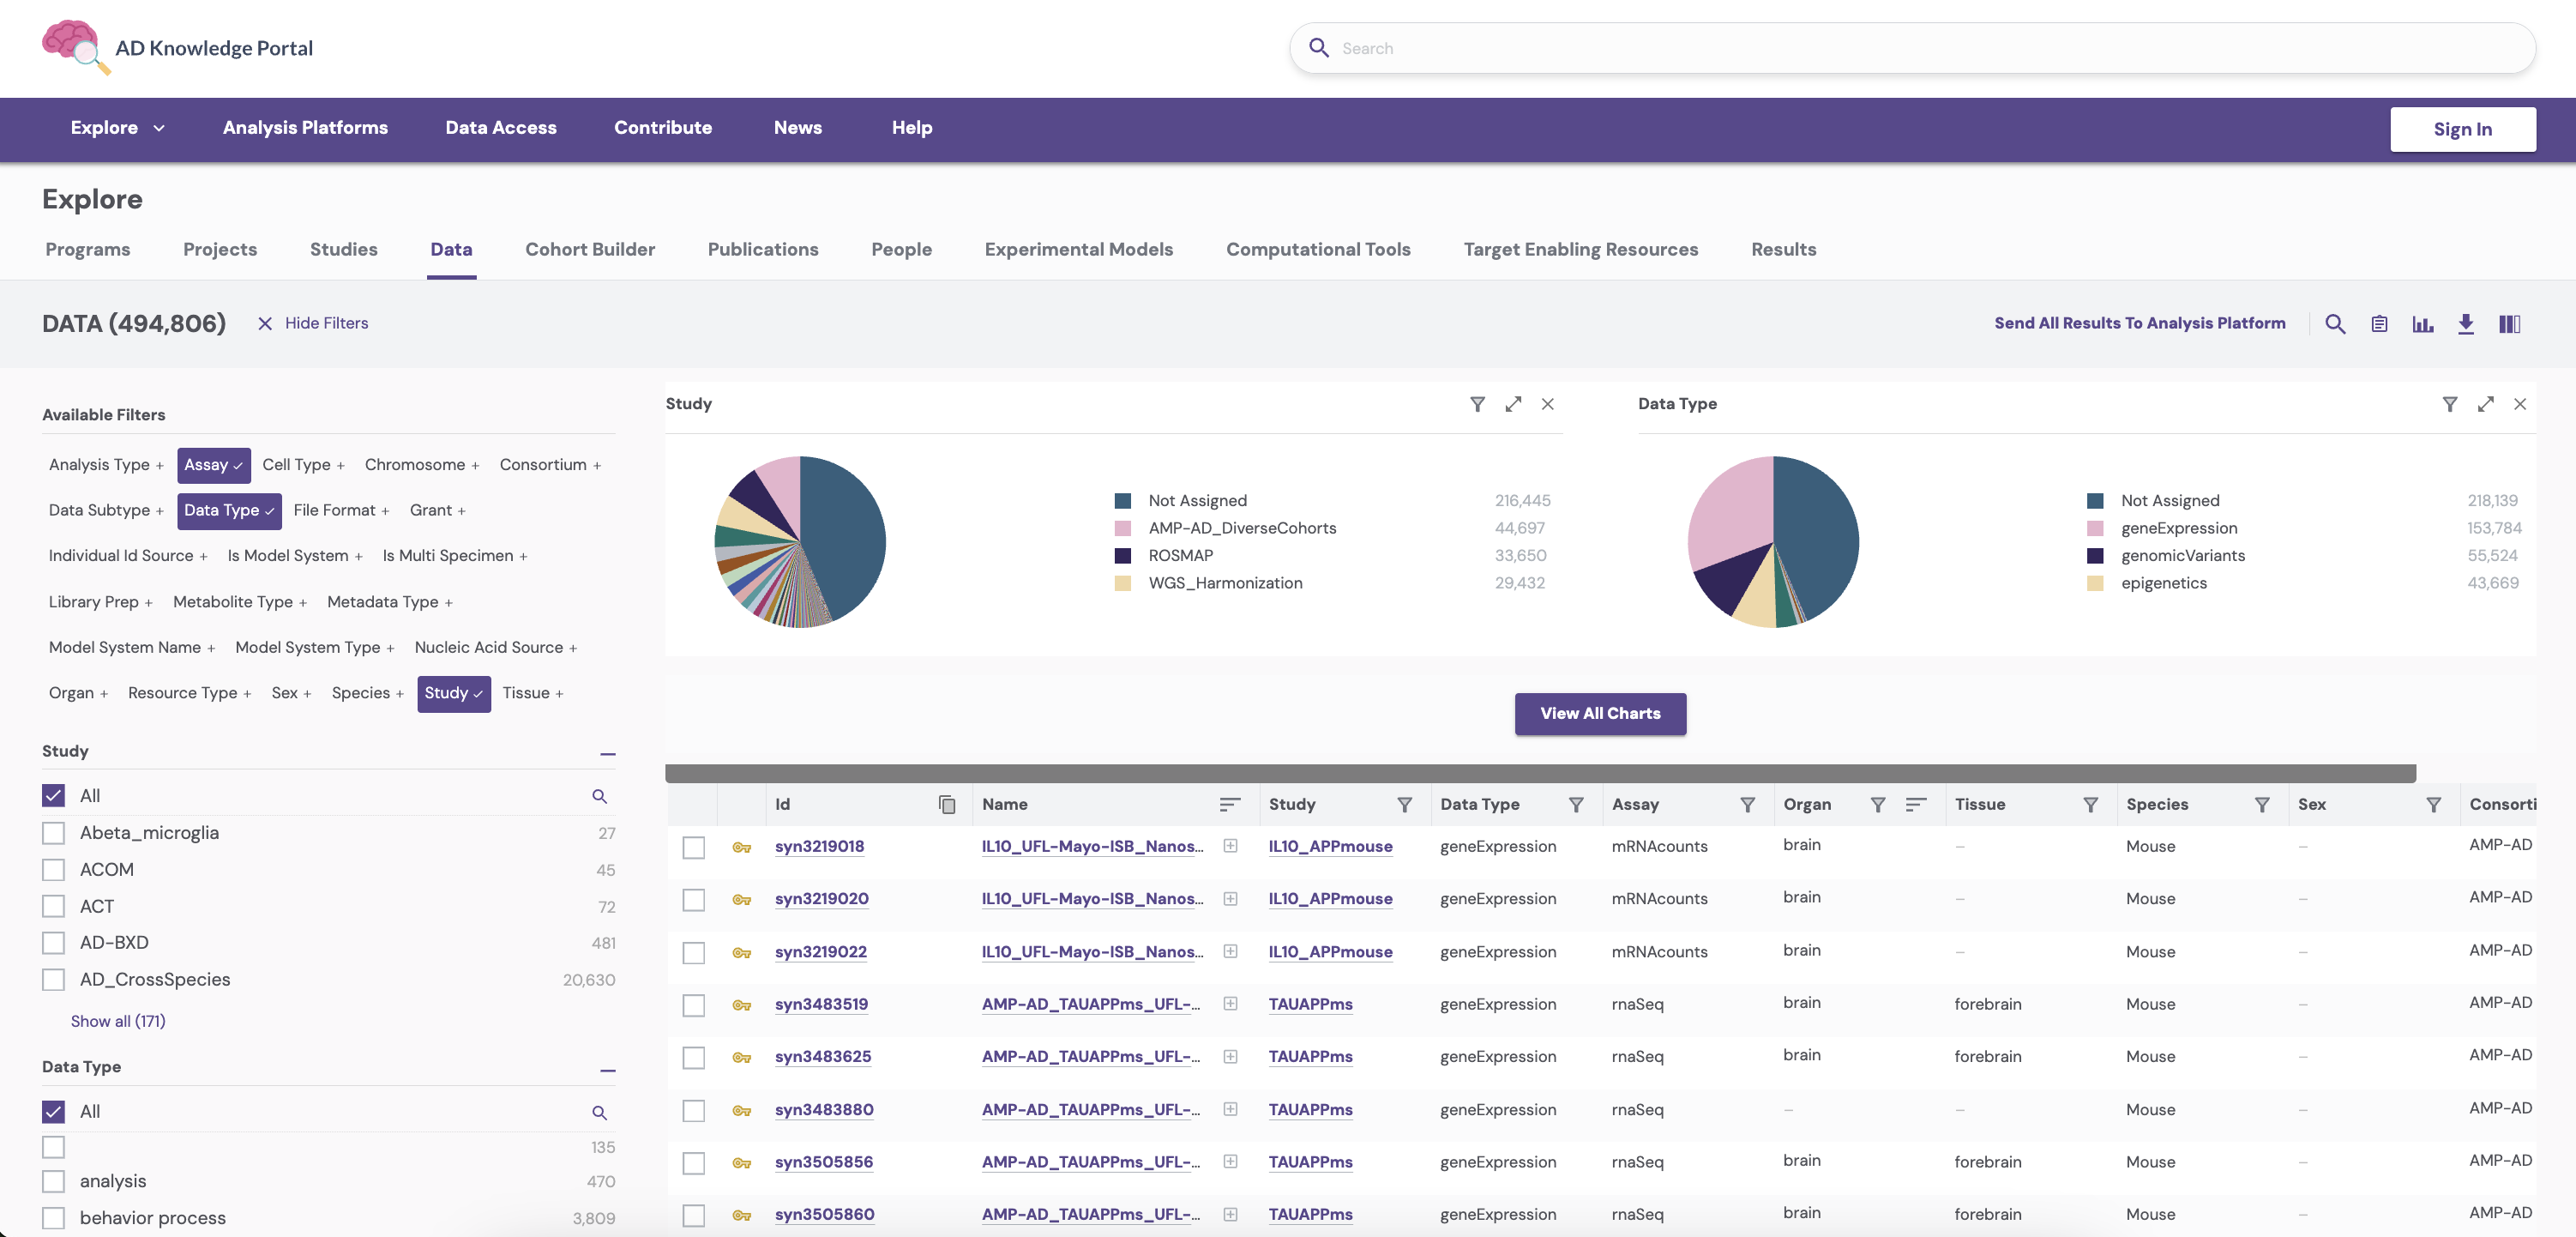
The Explore tab is your gateway to browsing and filtering data on the AD Knowledge Portal. Within the Data subtab, you’ll find a layout divided into three primary sections:
-
Visualization Charts (top): Provides visual summaries of the dataset.
-
Data Table (bottom): Displays detailed file information.
-
Filters (left): Helps you narrow down data based on specific criteria.
The numbers and data displayed in examples are dynamic and may vary as new data is uploaded to the portal.
Let’s break down each section on this page, starting with the filtering tools.
1. Filtering Tools
Upon landing on the Data subtab, all data stored in the system will appear in the table by default. In the image shown above, the table and associated graphs incorporate the total of 494,806 files stored (at the time this screenshot was taken). To narrow this data down, use the Filter Data By section on the left.
How to Use Filters:
-
Filter Categories: By default, you’ll see options like Study, Data Types, and Assays.
-
Expand Options: Click Show All at the bottom of each category to see all filters in that section.
-
Search Filters: Click the magnifying glass icon to search for specific values in each category.
-
Add More Filters: Use the Available Filters section to reveal additional filters like Species, File Format, and Model System Name. Filters already in use are marked with a checkmark. Select multiple filters to further narrow results.
-
Remove Filters: Remove specific filters by clicking the X next to them, or reset everything by selecting Clear All Filters in the top-right corner.
-
File Counts: Numbers next to filters show how many files match that option.
2. Search
The AD Knowledge Portal can also be queried using the AWS OpenSearch Service, either on its own, or in combination with filters. This implementation supports modern search features including auto-completion, ACL filtering and fuzzy matching. Fuzzy matching provides intuitive understanding of typos, abbreviations and synonyms used in search queries. Your search terms will populate above the available filters, as shown below.

3. Adjust Page Settings / Save Search Results
At the top right corner of the page, several tools allow you to customize your view.

From L->R:
-
Send All Results to Analysis Platform: As an alternative to direct download, send your results directly to the supported TRE of your choice. See Analysis Platforms (TREs) to learn more.
-
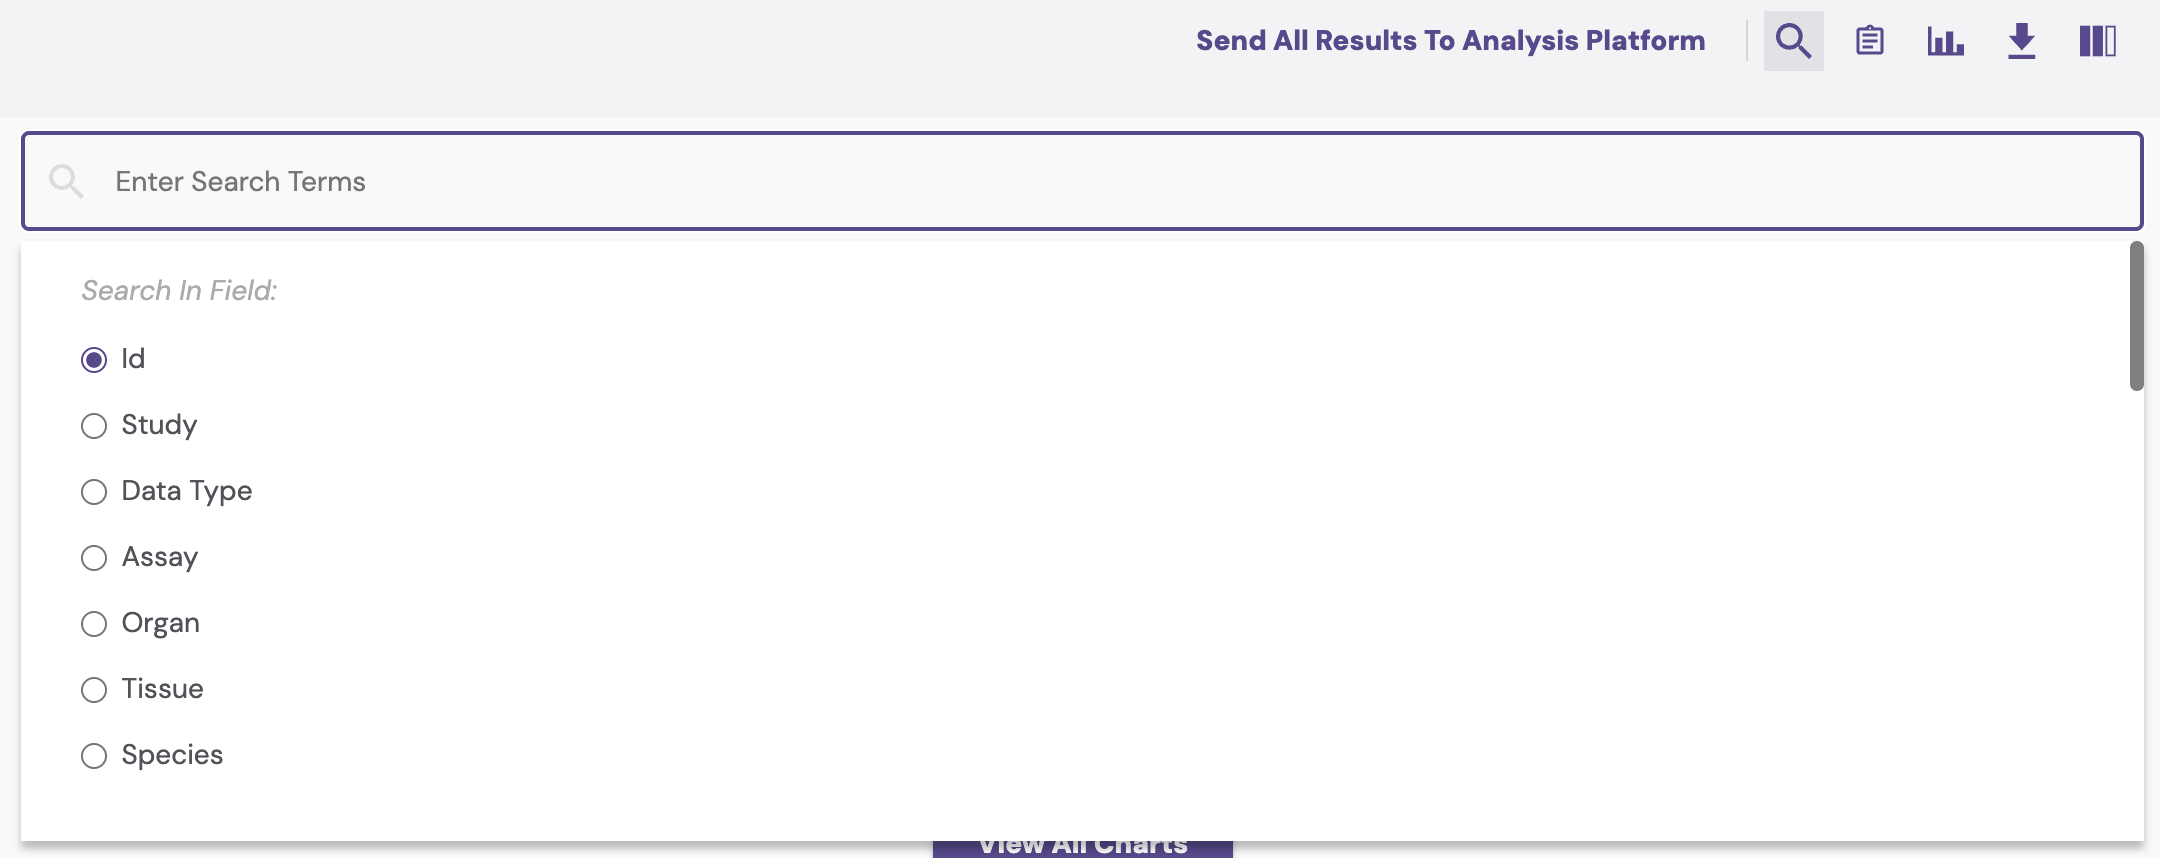
Show/Hide Full Text Search Bar: Toggle a search bar open or closed; search for specific terms within set categories. Keep in mind, this search bar uses MySQL Full Text Search. This feature is not able to correct for spelling mistakes, and does not perform “stemming” to identify the root of a word. For best results, search for the exact match you want, avoid pluralization or suffixes like -ing, and ensure your search term is spelled correctly.
-
Copy Search to Clipboard: Copy a URL to your exact search terms.
-
Show/Hide Visualizations: Toggle the visualization charts on or off.
-
Download Options: Export the data table as a .csv or .tsv file; use the Add to Download List feature to save files for download, or view Programmatic Options for downloading data files (Command Line, R, or Python).
-
Show/Hide Columns: Use the columns icon to hide or show specific fields in the data table.
4. Visualizations
Visualizations provide an interactive summary of your query results.
-
Filter by Charts: Click the filter icon on a chart to apply category-specific filters. This updates the overall data table and functions the same way as the filters on the left.
-
Expand/Contract Charts: Click the expand icon to enlarge any chart or contract it to return to its original size.
-
Customize Display: Add or remove charts using View All Charts or Hide Charts options.
5. Data Table
The results of your query will appear in the data table below the visualizations section. Each row represents a single file. Each table column contains metadata, or “data about data,” specific to a file.
Key table features include:
-
Filter Icons: Click on the filter icons at the top of each column to further narrow your query. This updates the overall data table and functions the same way as the filters on the left.
-
Sort Icons: Click on the sort icons at the top of each column to sort your results according to that attribute.
-
Copy IDs to clipboard: Copy a list of individual file IDs.
-
Pagination: View 10, 25 or 100 rows at a time. View additional rows by navigating with the Next/Previous buttons below the table.
-
Access Icons:
-
Key Icon: Indicates restricted access. Click to request access.
-
Unlock Icon: Indicates open access or that you have fulfilled access requirements.
-
-
Use the horizontal scroll bar below the table to view additional metadata categories.
Column Headers:
Numerous columns can be added to the data table; each column represents a specific metadata attribute which describes the data in the files. A few are worth defining here:
-
Name: The file’s name.
-
ID: The Synapse ID associated with the file or other Synapse entity; this is a unique, unchanging identifier, formatted as syn12345678.
-
Study: Abbreviation of the associated AD Knowledge Portal study.
-
Is Model System: Indicates if the file includes data from an animal model (mouse, rat, marmoset, or drosophila) or another type of model system (e.g. human cell lines).
-
Is Multi Specimen: Indicates if the file contains data from multiple biospecimens.
6. Download Data
There are several options for choosing files to download.
-
Select Files individually: Use checkboxes to select specific files to download or send to the TRE of your choice.
-
Select all Files: Immediately download or send all files included in the current data table to the TRE of your choice.
-
Add files to the Download List over several sessions: You must be logged in with your Synapse account. Your selected files will remain in your Download List until you either clear it or download the selected files.
Access your Download List by clicking on the downward arrow icon in the top navigation bar, then select the Bulk Download Option of your choice.
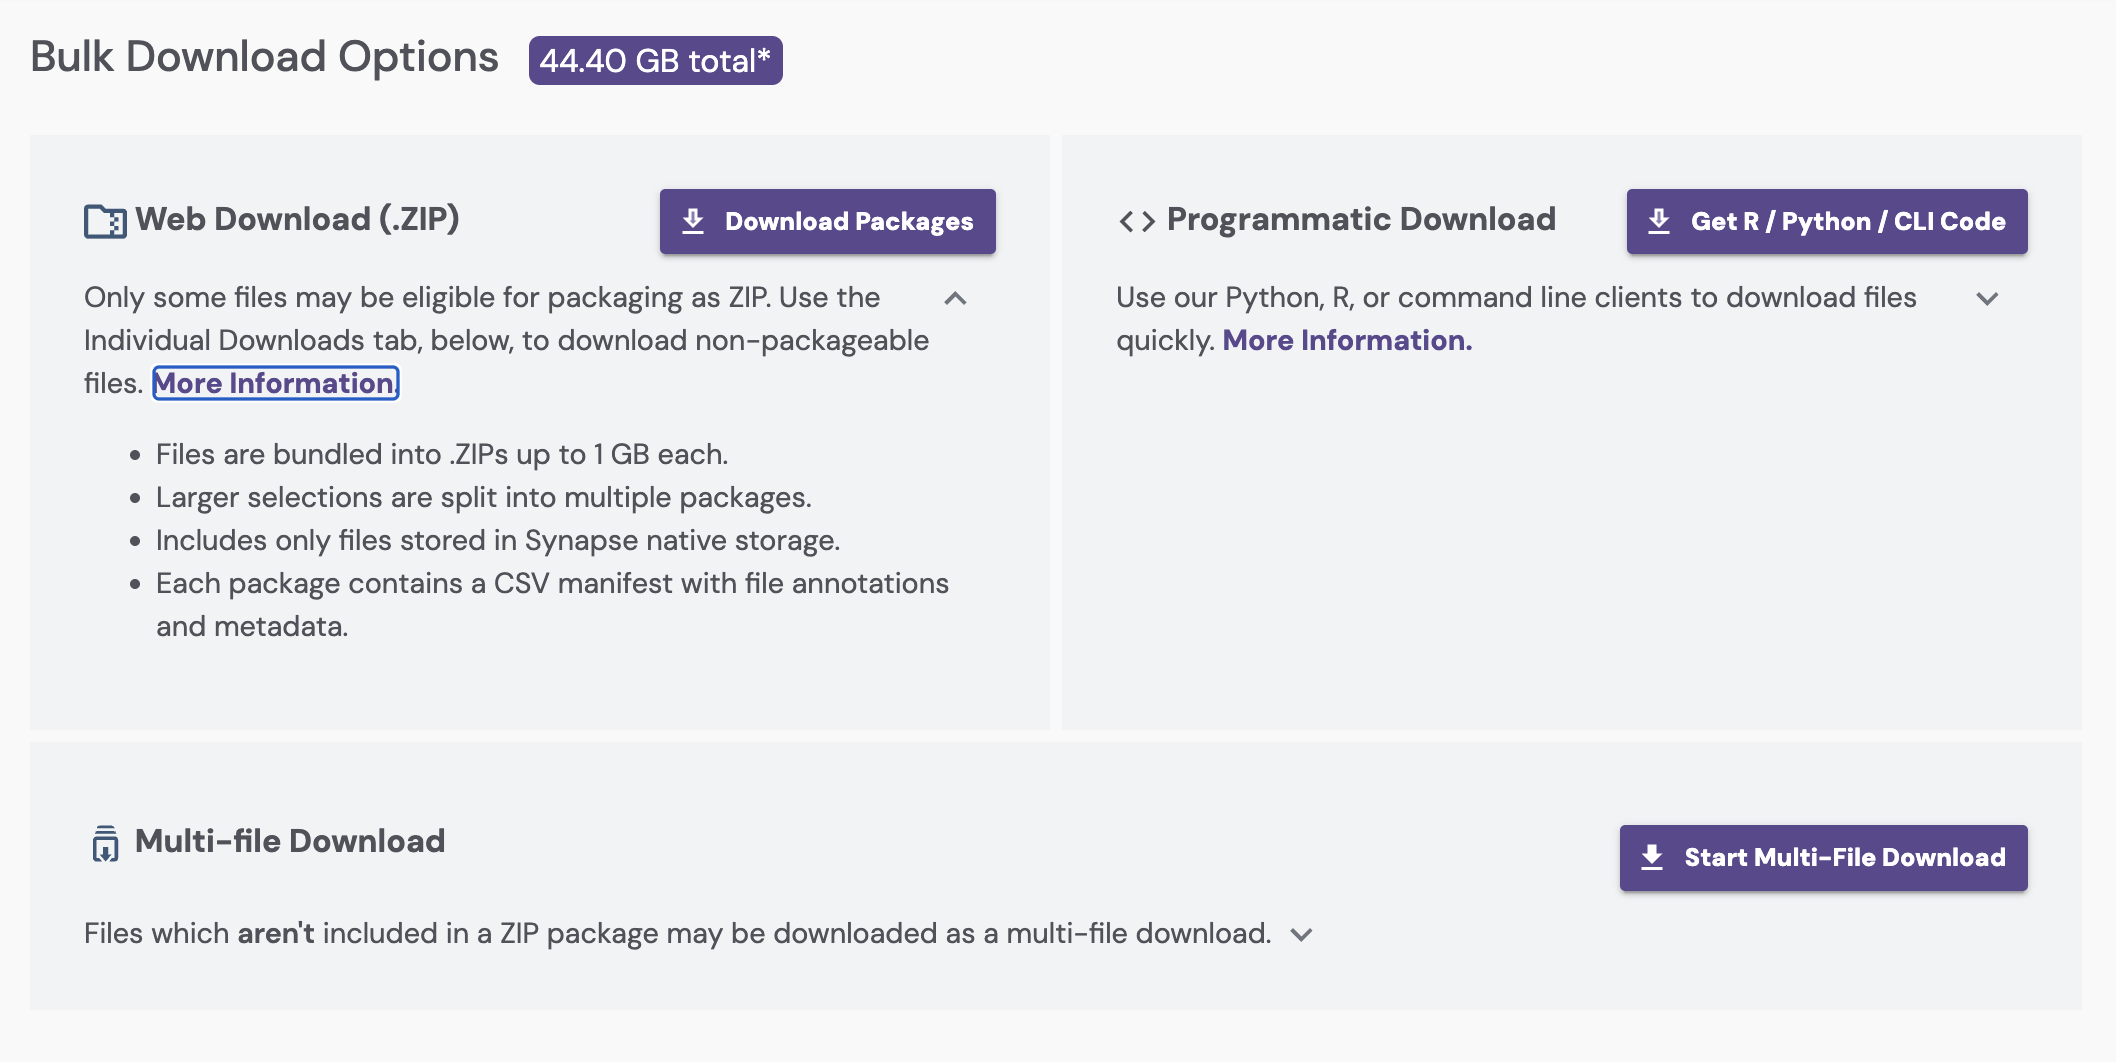
For advanced users: Download data programmatically using Python, R, or the Synapse Command Line client. Detailed instructions are available in the Synapse Docs.
7. Find/Download Metadata Files
All Portal Data is organized within a hierarchy of Programs, Projects and AD Knowledge Portal Study(ies) (see: Information Architecture). In addition to the data itself, studies contain descriptive wiki content and structured metadata files which describe the data. Joining study data together with metadata creates a comprehensive view of each file.
-
From the Study Details page, navigate to the Study Data tab.
-
From the Table of Contents on the left, click Study Metadata, or scroll down to the Metadata Table.
-
Finally, filter the metadata down to the files which are relevant to your selected data, and follow the same instructions as explained in the Download data section (above) to download metadata files.
To learn more about how metadata is organized in the AD Knowledge Portal, and how to join metadata files with data files, we encourage you to read the Metadata article next.
Example Scenarios
The general steps outlined above are provided at a high level; you can find more detailed, step-by-step instructions described in the following example scenarios.
-
Use Case #1: Find and Download Files Associated With a Selected Study
-
Use Case #2: Download Files in Bulk Using the Command Line Client