Accessing Data
This is likely the reason you’re visiting the AD Portal in the first place—to access data. The portal offers helpful filtering tools to help you find that data of interest. All of the data and resources uploaded into the portal are associated with metadata and annotations, so they can be easily used to help query the list of resources in each page. You can find a detailed breakdown of metadata definitions and explanations in our metadata dictionary and instructions on how to use that dictionary here.
How can you find and download metadata files? More on that here (bottom of this page).
Is all data equally accessible?
Anyone can browse public content on the AD portal, but you need a Synapse account in order to download data. Register for an account here.
In addition, some data requires the use of a Data Use Certificate (DUC), which takes time to process. Learn how to complete a DUC here.
![]() The Rush Alzheimer's Disease Center (RADC) has additional phenotypic data on the ROSMAP cohort. You must request access to this data directly through the RADC.
The Rush Alzheimer's Disease Center (RADC) has additional phenotypic data on the ROSMAP cohort. You must request access to this data directly through the RADC.
![]() Data generated on the ADNI cohort is indexed in the AD Knowledge Portal, but hosted in the USC Laboratory of Neuro Imaging (LONI). In order to download ADNI data hosted in LONI, you must request access through the ADNI.
Data generated on the ADNI cohort is indexed in the AD Knowledge Portal, but hosted in the USC Laboratory of Neuro Imaging (LONI). In order to download ADNI data hosted in LONI, you must request access through the ADNI.
Get started exploring data
In the Explore tab, the various subtabs correspond to how the data is categorized for your filtering purposes. To demonstrate the best practices for finding data, let’s look at the Data subtab.
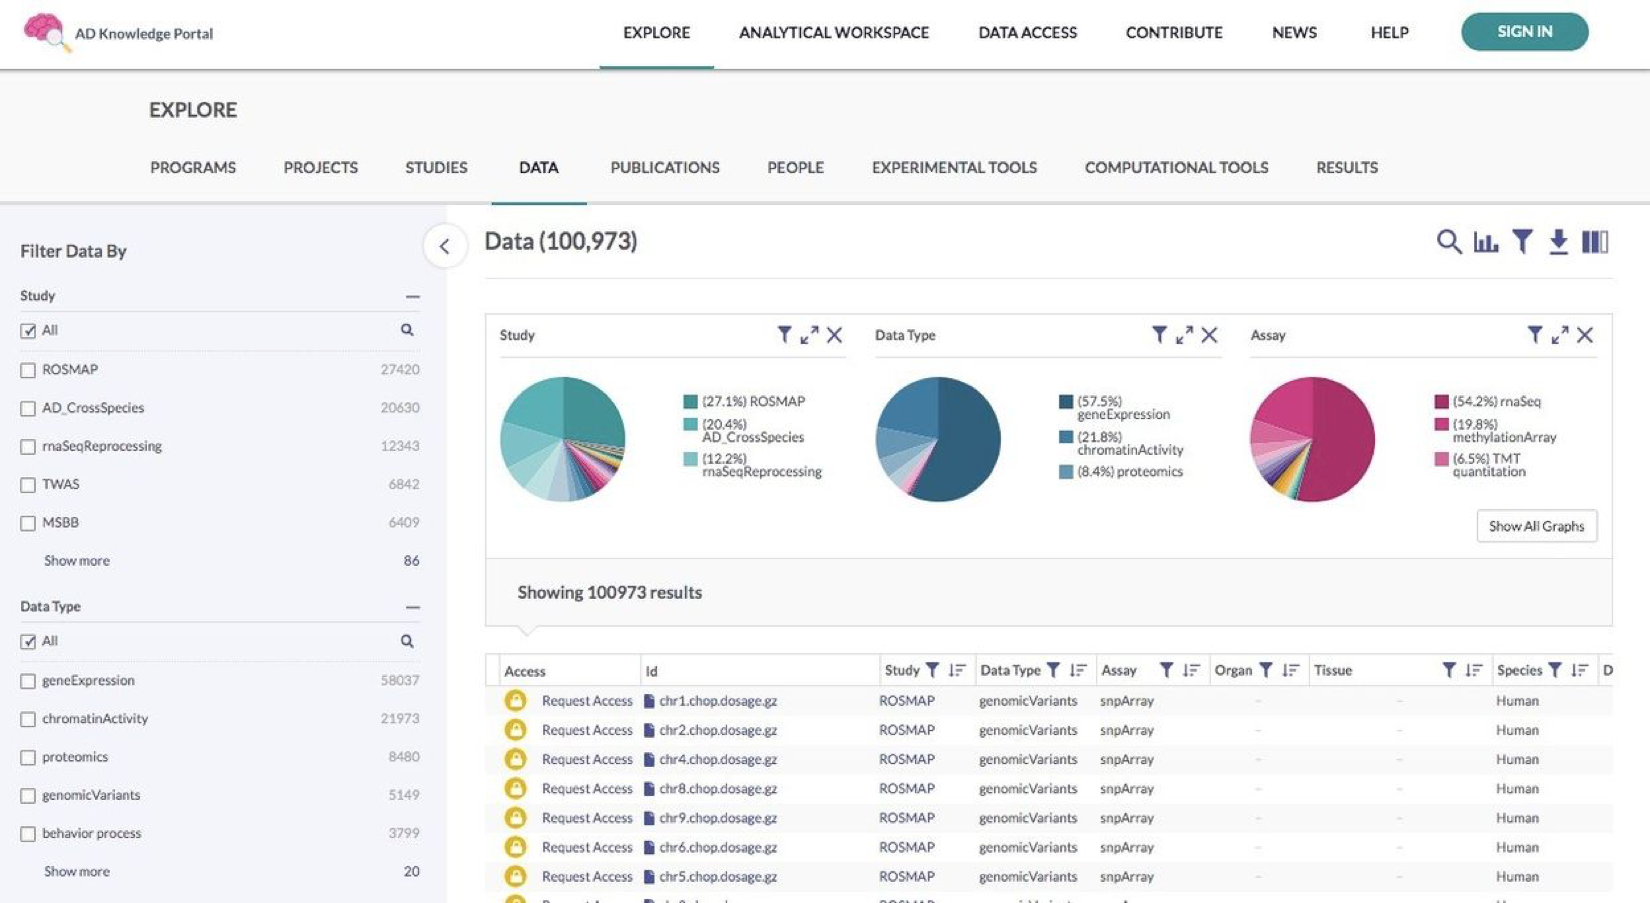
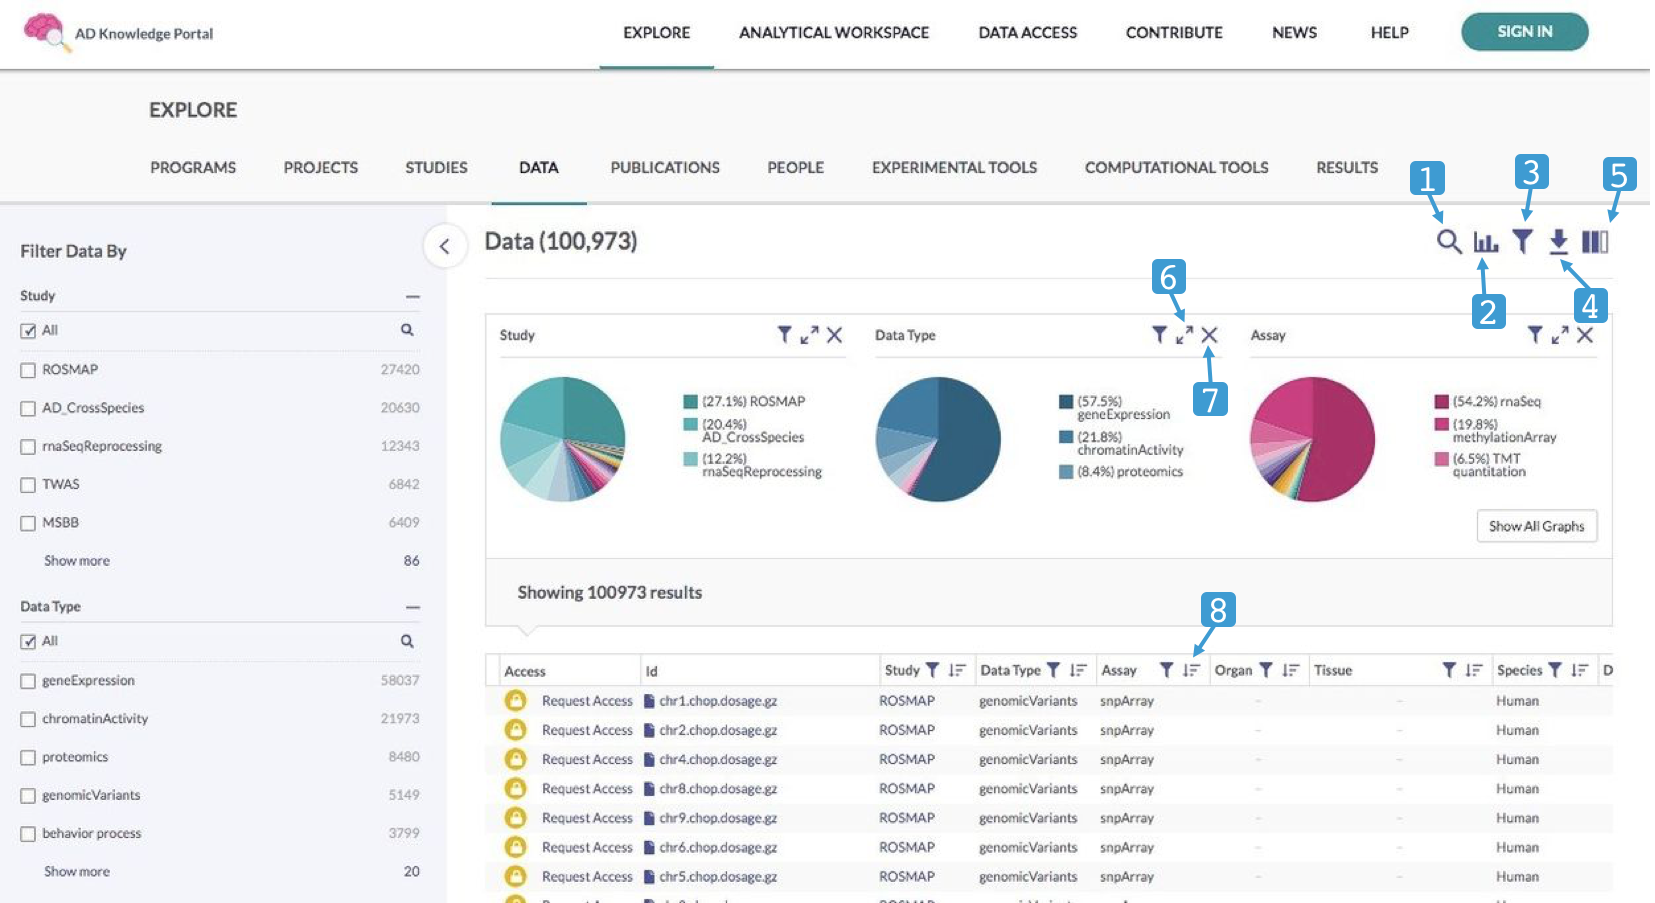
Notice that the page is made up of three sections: visualization charts on top, the data table below, and the filtering tools on the left. There are also a few settings you can use at the top right. Let’s break down each section on this page, starting with the filtering tools.
![]() Please note: The data and numbers displayed in the screenshot above reflects the portal at that moment in time—this will likely be different than what you see when exploring the portal yourself, since the portal is dynamic and changes as new data is uploaded and processed.
Please note: The data and numbers displayed in the screenshot above reflects the portal at that moment in time—this will likely be different than what you see when exploring the portal yourself, since the portal is dynamic and changes as new data is uploaded and processed.
Filtering tools
Upon landing on the Data subtab, all data stored in the system will appear in the table by default. In the image shown above, the table and associated graphs incorporate the total of 100,973 files stored (at the time this screenshot was taken). To narrow this data down, use the Filter Data By section on the left.
Filter Data By is broken into sections that will differ depending on the subtab that you’re exploring.
To help explain how to use these sections, refer to the following bullet points and the corresponding image below:
red arrows → When exploring the Data subtab, the Filter Data By sections that appear by default are: Study, Data Type, and Assay
red rectangle → There are various other categories that you can expand and filter by as well—click the plus sign next to any of these (Organ, Tissue, Species, Diagnosis, etc.) to reveal its filtering options
red circles → At the end of each category, click on Show more to reveal all filters for that category
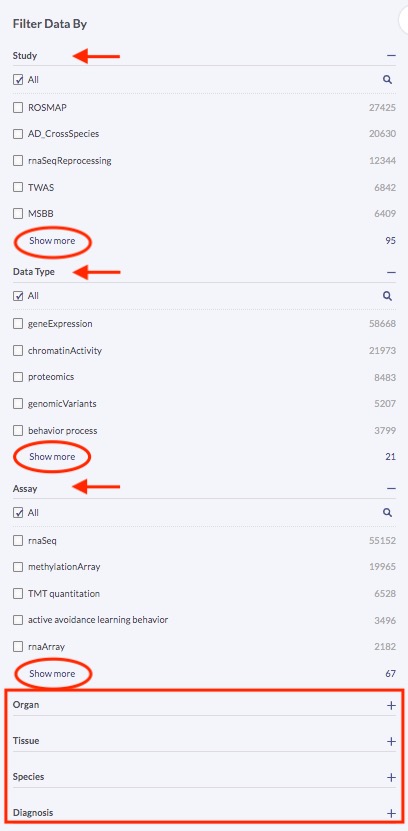
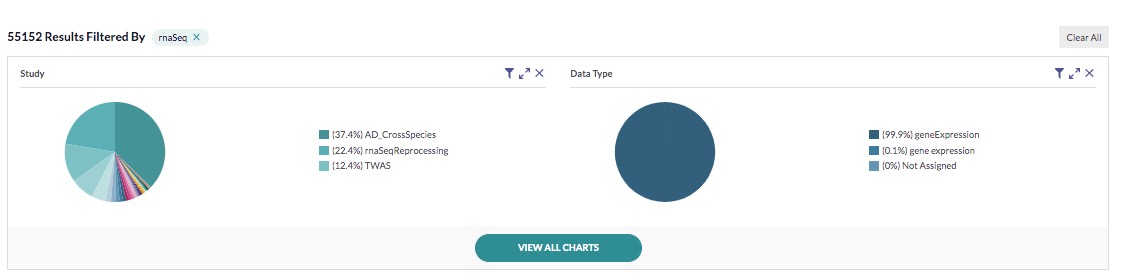
Notice how, by default, each of the categories have a checkmark in the box labelled All. Before you apply any filters for a category, it will include all files within that category until a filter(s) is applied. Next to each filtering option is a number—this indicates how many files will be included once that specific filter is applied. For example, looking at the image above, if you check the rnaSeq box under the Assay section, the files will be narrowed down to 55,152 results, as seen in the image below.
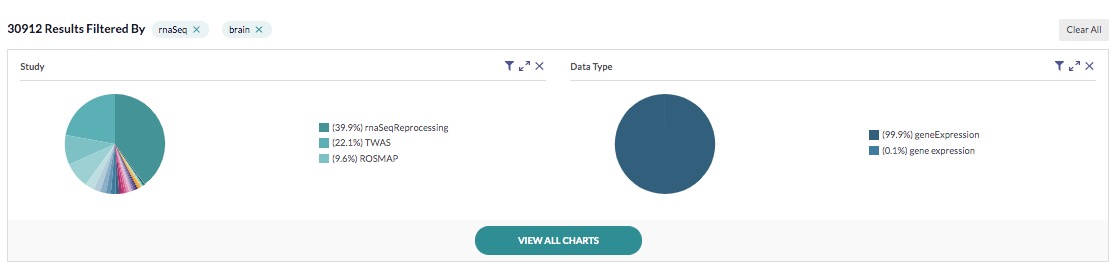
Selecting filters from more than one category will further narrow down the results. For example, if you were to expand the Organ section and check the Brain box (in addition to the rnaSeq filter), your results would be narrowed to 30,912, as seen in the image below.
You can play around with the filtering options as you wish to narrow down the search and find your data of interest. Each additional filter will appear in the section under the charts—you can easily remove individual filters as necessary, or click Clear All (top right) to remove all filters and start over.
Visualizations
This section of charts at the top of the page will display visualizations for each category according to the data you’ve filtered. You can use the filter icon (3️⃣) for any chart to adjust the filters for that category—this will change the results as a whole (not just for that chart), just as it would if you changed the filters under Filter Data By.
Use the expand icon (6️⃣) to make that specific chart bigger and the contract icon (inverse of 6️⃣) to return back to normal size.
By default, the charts displayed are for the categories Study and Data Type. Click VIEW ALL CHARTS to display charts for all categories, and HIDE CHARTS to restore the default display.
Click the X (7️⃣) next to any chart to temporarily remove that chart from view.
Data table
The data that you’ve filtered for will appear in the data table below the visualizations section. Notice how it’s organized by category—you can use the filter icon (3️⃣) next to any category header to change the filters, just as it would if you changed the filters under Filter Data By. Use the reorder icon (8️⃣) next to any of the category headers to rearrange the table data in reverse based on that category.
Use the horizontal scroll bar below the table to reveal extra category columns.
The table will only fit 25 rows of data—click Next or Previous to shuffle through more rows as needed.
Additional settings
At the top of the page, above the visualization section, there are several icons you can use to adjust the page settings.
The search icon (1️⃣) allows you to search for specific terms to filter for instead of going through all the categories in the Filter Data By section. You can select a certain category to search within. Click the icon again to hide the search bar.
The graph icon (2️⃣) allows you to hide/show the Visualizations section.
The filter icon (3️⃣) allows you to hide/show the Filter Data By section.
The download icon (4️⃣) allows you to export the currently displayed table in .csv or .tsv format. To do so, click Add to Download Cart to save the table to a list available for download directly from the portal at any time. You also have the option to click Programmatic Options, which allows you to download the table via the Synapse command line client.
Finally, the columns icon (5️⃣) allows you to customize the table by adding or removing specific columns.
Downloading data
You can download data from the Synapse web interface, which has a maximum download size of 5 GB or 100 files. Find instructions on how to download files from Synapse here.
Alternatively, you can download data using programmatic clients (Python, R, and command line). This method requires some technical knowledge, but you can learn the basic commands to do this in Synapse Docs. Find instructions on how to download files programmatically here.
You can also download data directly from the AD Knowledge Portal like so:
Once you have narrowed down your data of interest, and have been granted access to the data, click the Download Options icon (4️⃣) and select Add to Download Cart from the dropdown menu. You may be asked if you would like to add all files to the download list—click Add
Once your files are ready to download (give it a few seconds), you will see a shopping cart in the top right corner (it should indicate the number of files queued in your download list)—click on that icon
Then, click Download As .Zip Packages
The general steps outlined above are provided at a high level—you can find more detailed, step-by-step instructions at Use Case #1: Find and Download Files Associated with a Selected Study.
Data exploration tips
Here are a few tips to help make the most of your data exploration:
When using the search function, type exact terms—unlike Google or other search engines, our search function may not return accurate results for misspelled or incomplete terms
For a high-level view of the kinds of data available in the portal, browse the visualizations (mentioned earlier on this page) that are located on every Explore page.
Most programs, projects, studies, and publications have associated detail pages where you can drill down into its associated details and related data. For example, if you visit the The Religious Orders Study and Memory and Aging Project (ROSMAP) Study detail page, you can view relevant details such as its study description and methods, acknowledgement statements, related studies, and associated data.
How to find and download metadata files
Not exactly sure what metadata really is? Read up on that here.
So, you’ve narrowed down your data of interest using some combination of the data exploration and downloading tools above—but how do you find and download the associated metadata?
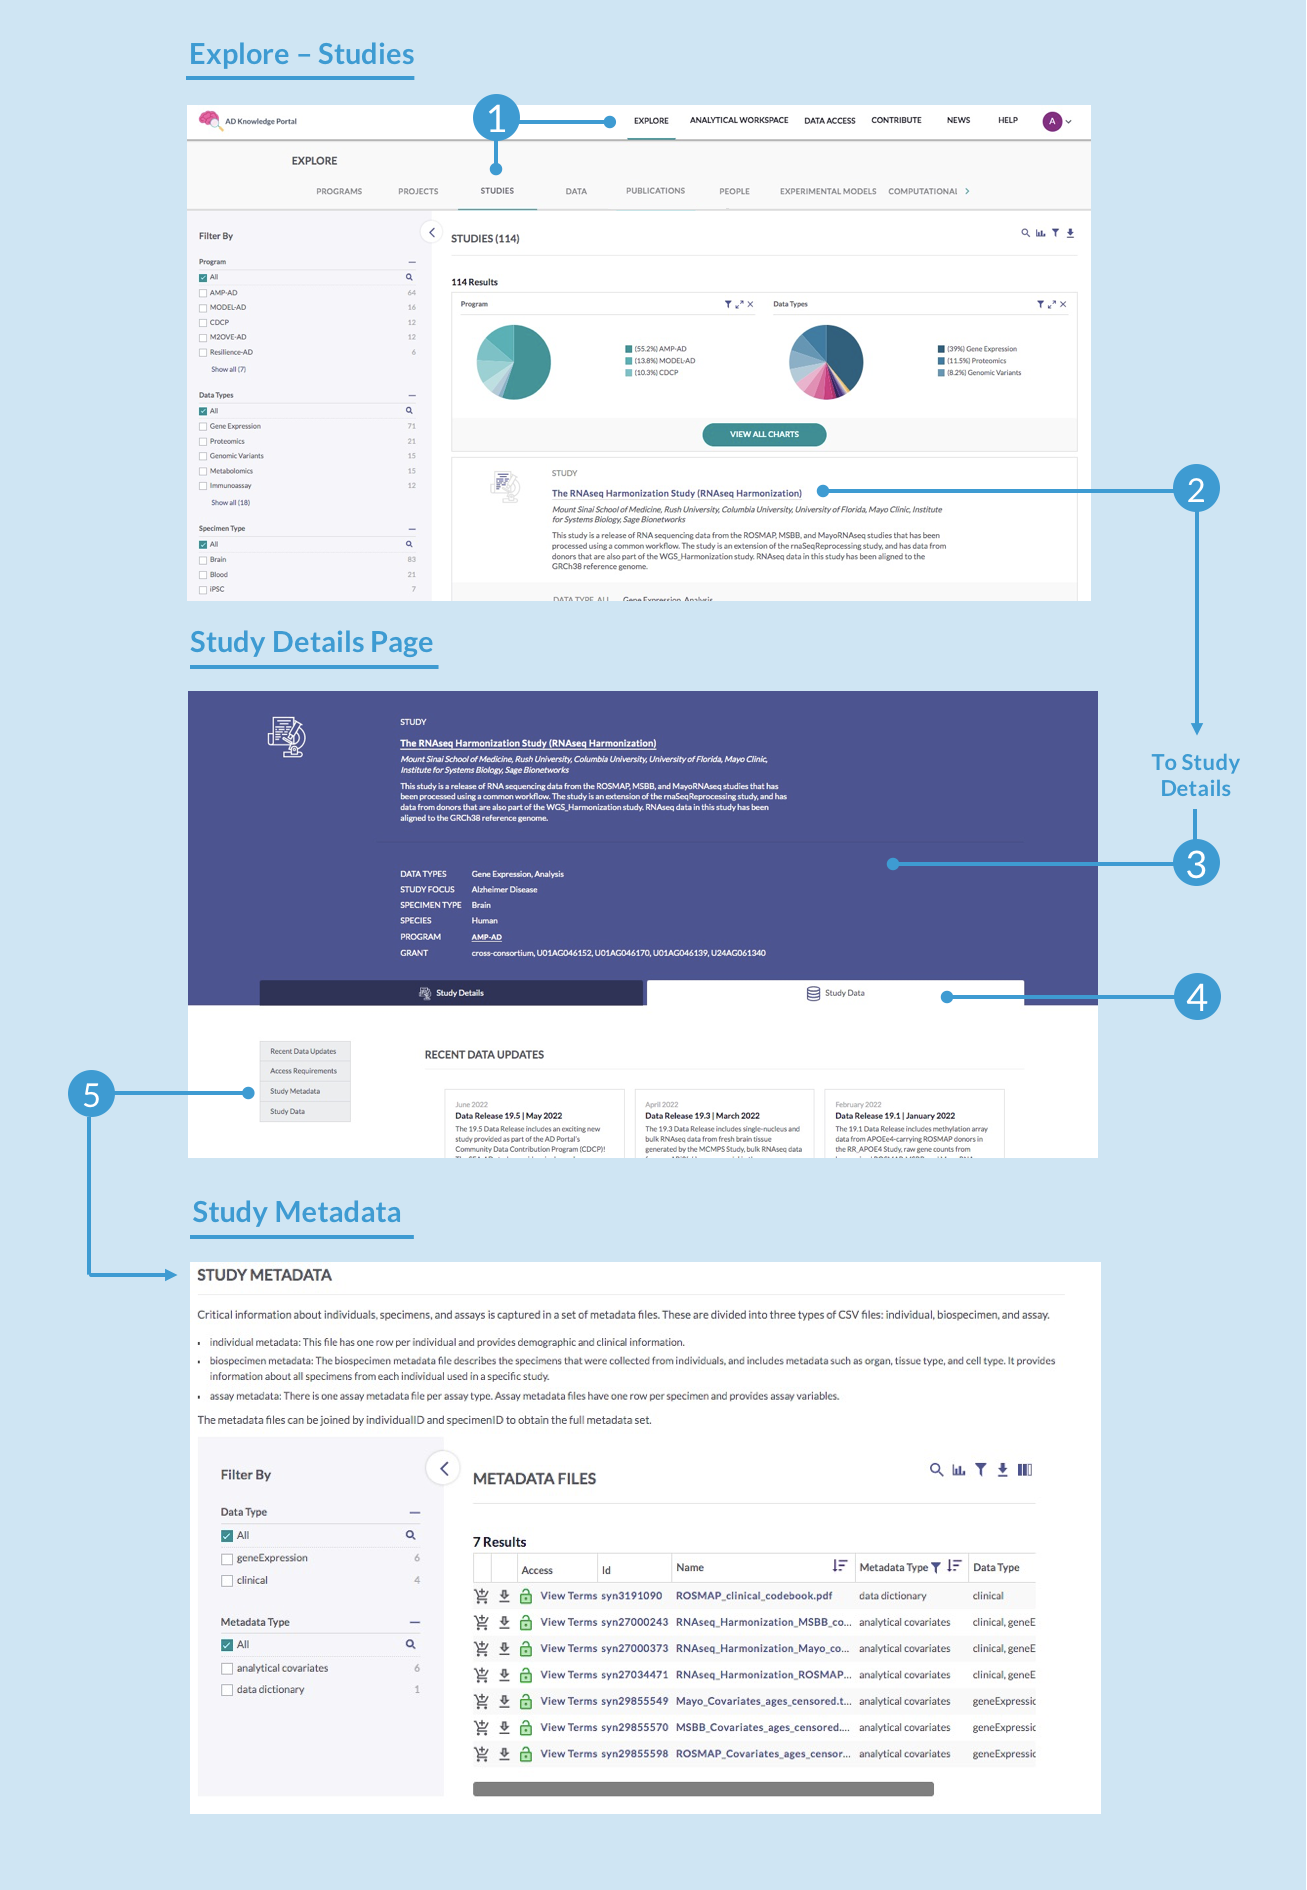
Metadata files are associated with specific studies. Regardless of how you narrowed down your data of interest, there is only one way to download metadata files. Reference the labelled images below along with the instructions.
Go to Explore → Studies (1) and click on the study that you want to download metadata files for
From the list of studies, click on the name of the study (2) (you can find the study using the filtering tools or search tool)
On the resulting Study Details page (3), click the Study Data tab (4)
From the table of contents on the left, click Study Metadata (5)
Then, filter the metadata down if you wish, and follow the same instructions as explained in Downloading data (above)
For a more specific breakdown of accessing metadata for a particular study, finding specific metadata of interest, and joining metadata files with data for that study, see our Use Case #3: Accessing and Joining Metadata Files With Data.